Transform the Physical World into Actionable Digital Insights
What Does It Do?
Fusion Gemini lets organisations and teams create and maintain digital models of their world. A model can simultaneously represent tangible things such as a person, building, or piece of equipment, and things you can’t touch, like an event, a process, or an idea.
Multi-modal data such as images, video, documents or values from IoT & wearable devices, can be collected directly into Fusion Gemini and combined into the model. This provides capabilities for real-time monitoring and decision making along with historic reporting and simulation capabilities.
Fusion Gemini is fully customisable and includes built-in development tools to help create bespoke visualisations, reporting, analysis and integrations.


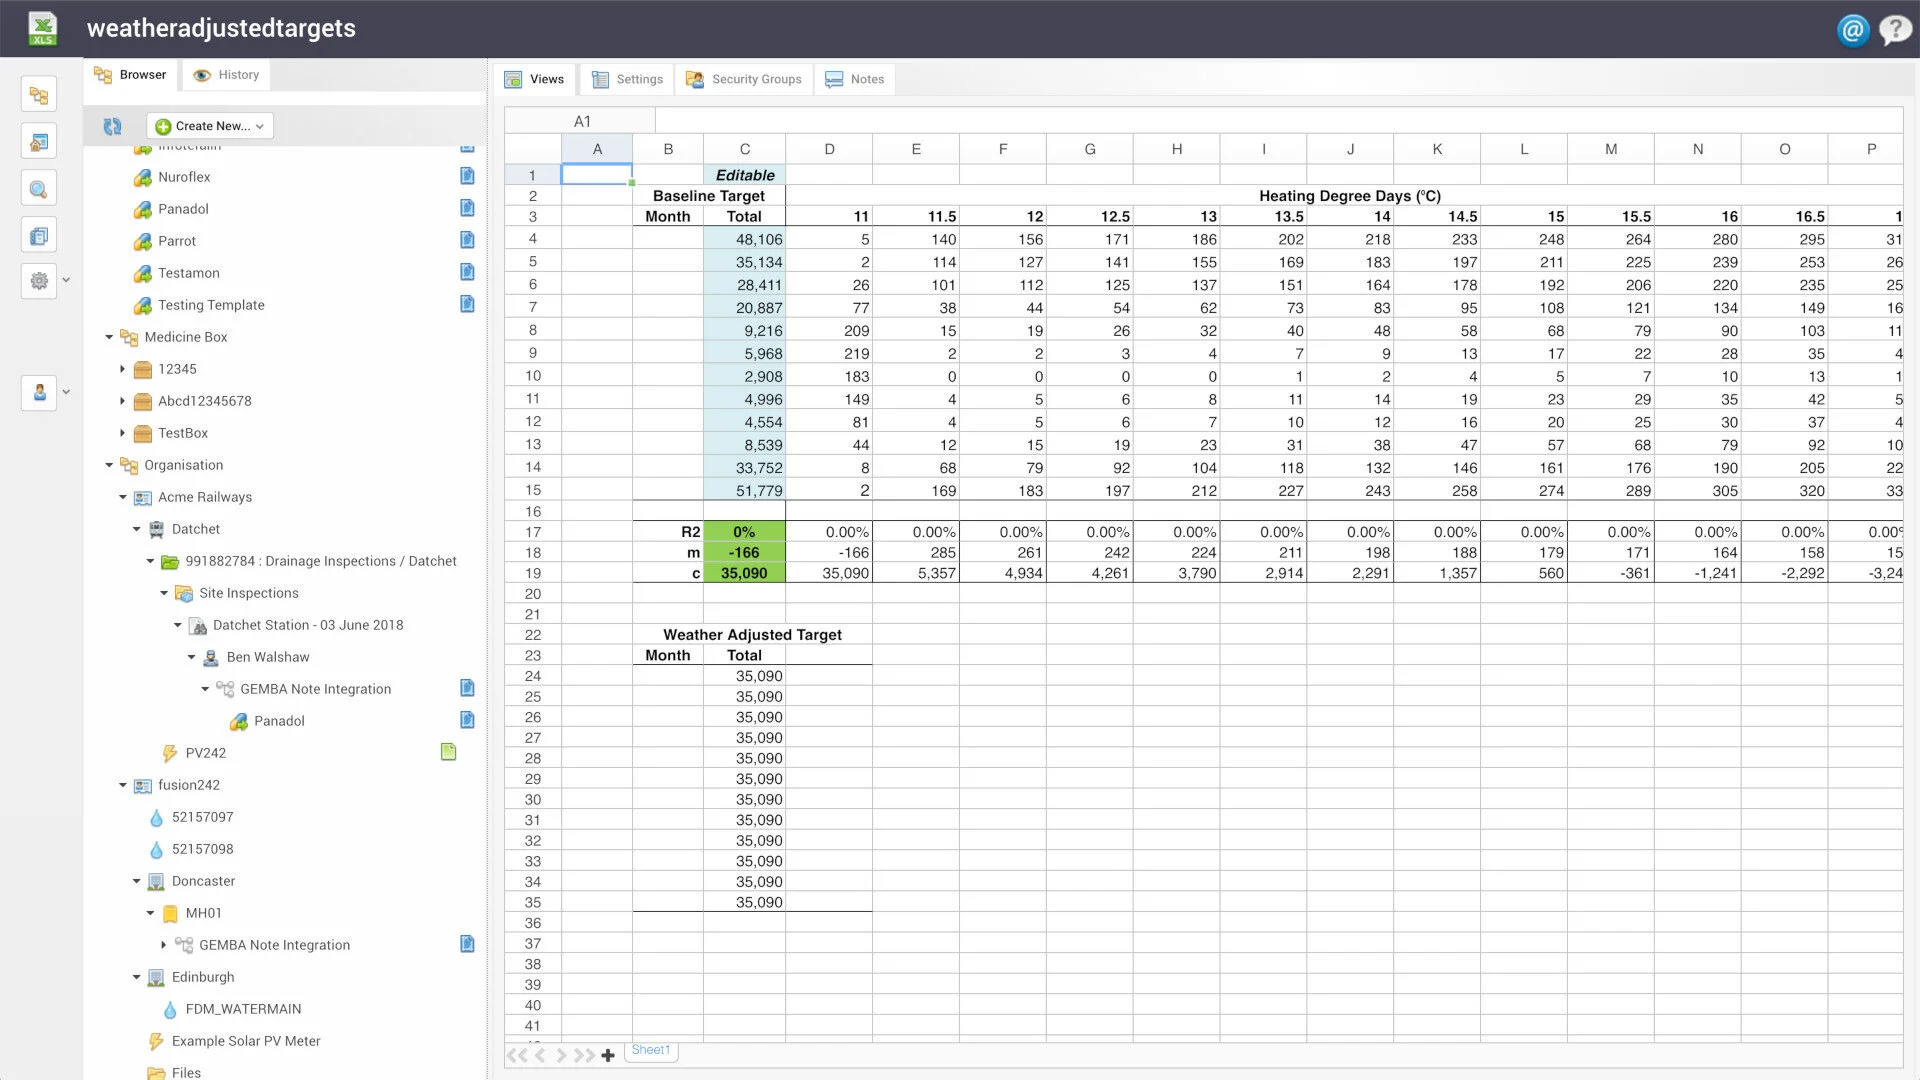
IoT & data management
A smart data capability with support for multi modal data sources as well as a comprehensive time-series layer for IoT, wearables & other hardware or systems integration is included. Spatial data can be associated with relevant entities and used in searches or decision making.
Scale at Your Own Pace
Model taxonomies and content can be evolved over time with no coding, allowing initial implementations that solve smaller problems to grow organically or strategically. The taxonomies that support these models can be reused by similar organisations or departments allowing specialist twins to be replicated easily with new data.

API and Portal in One Platform
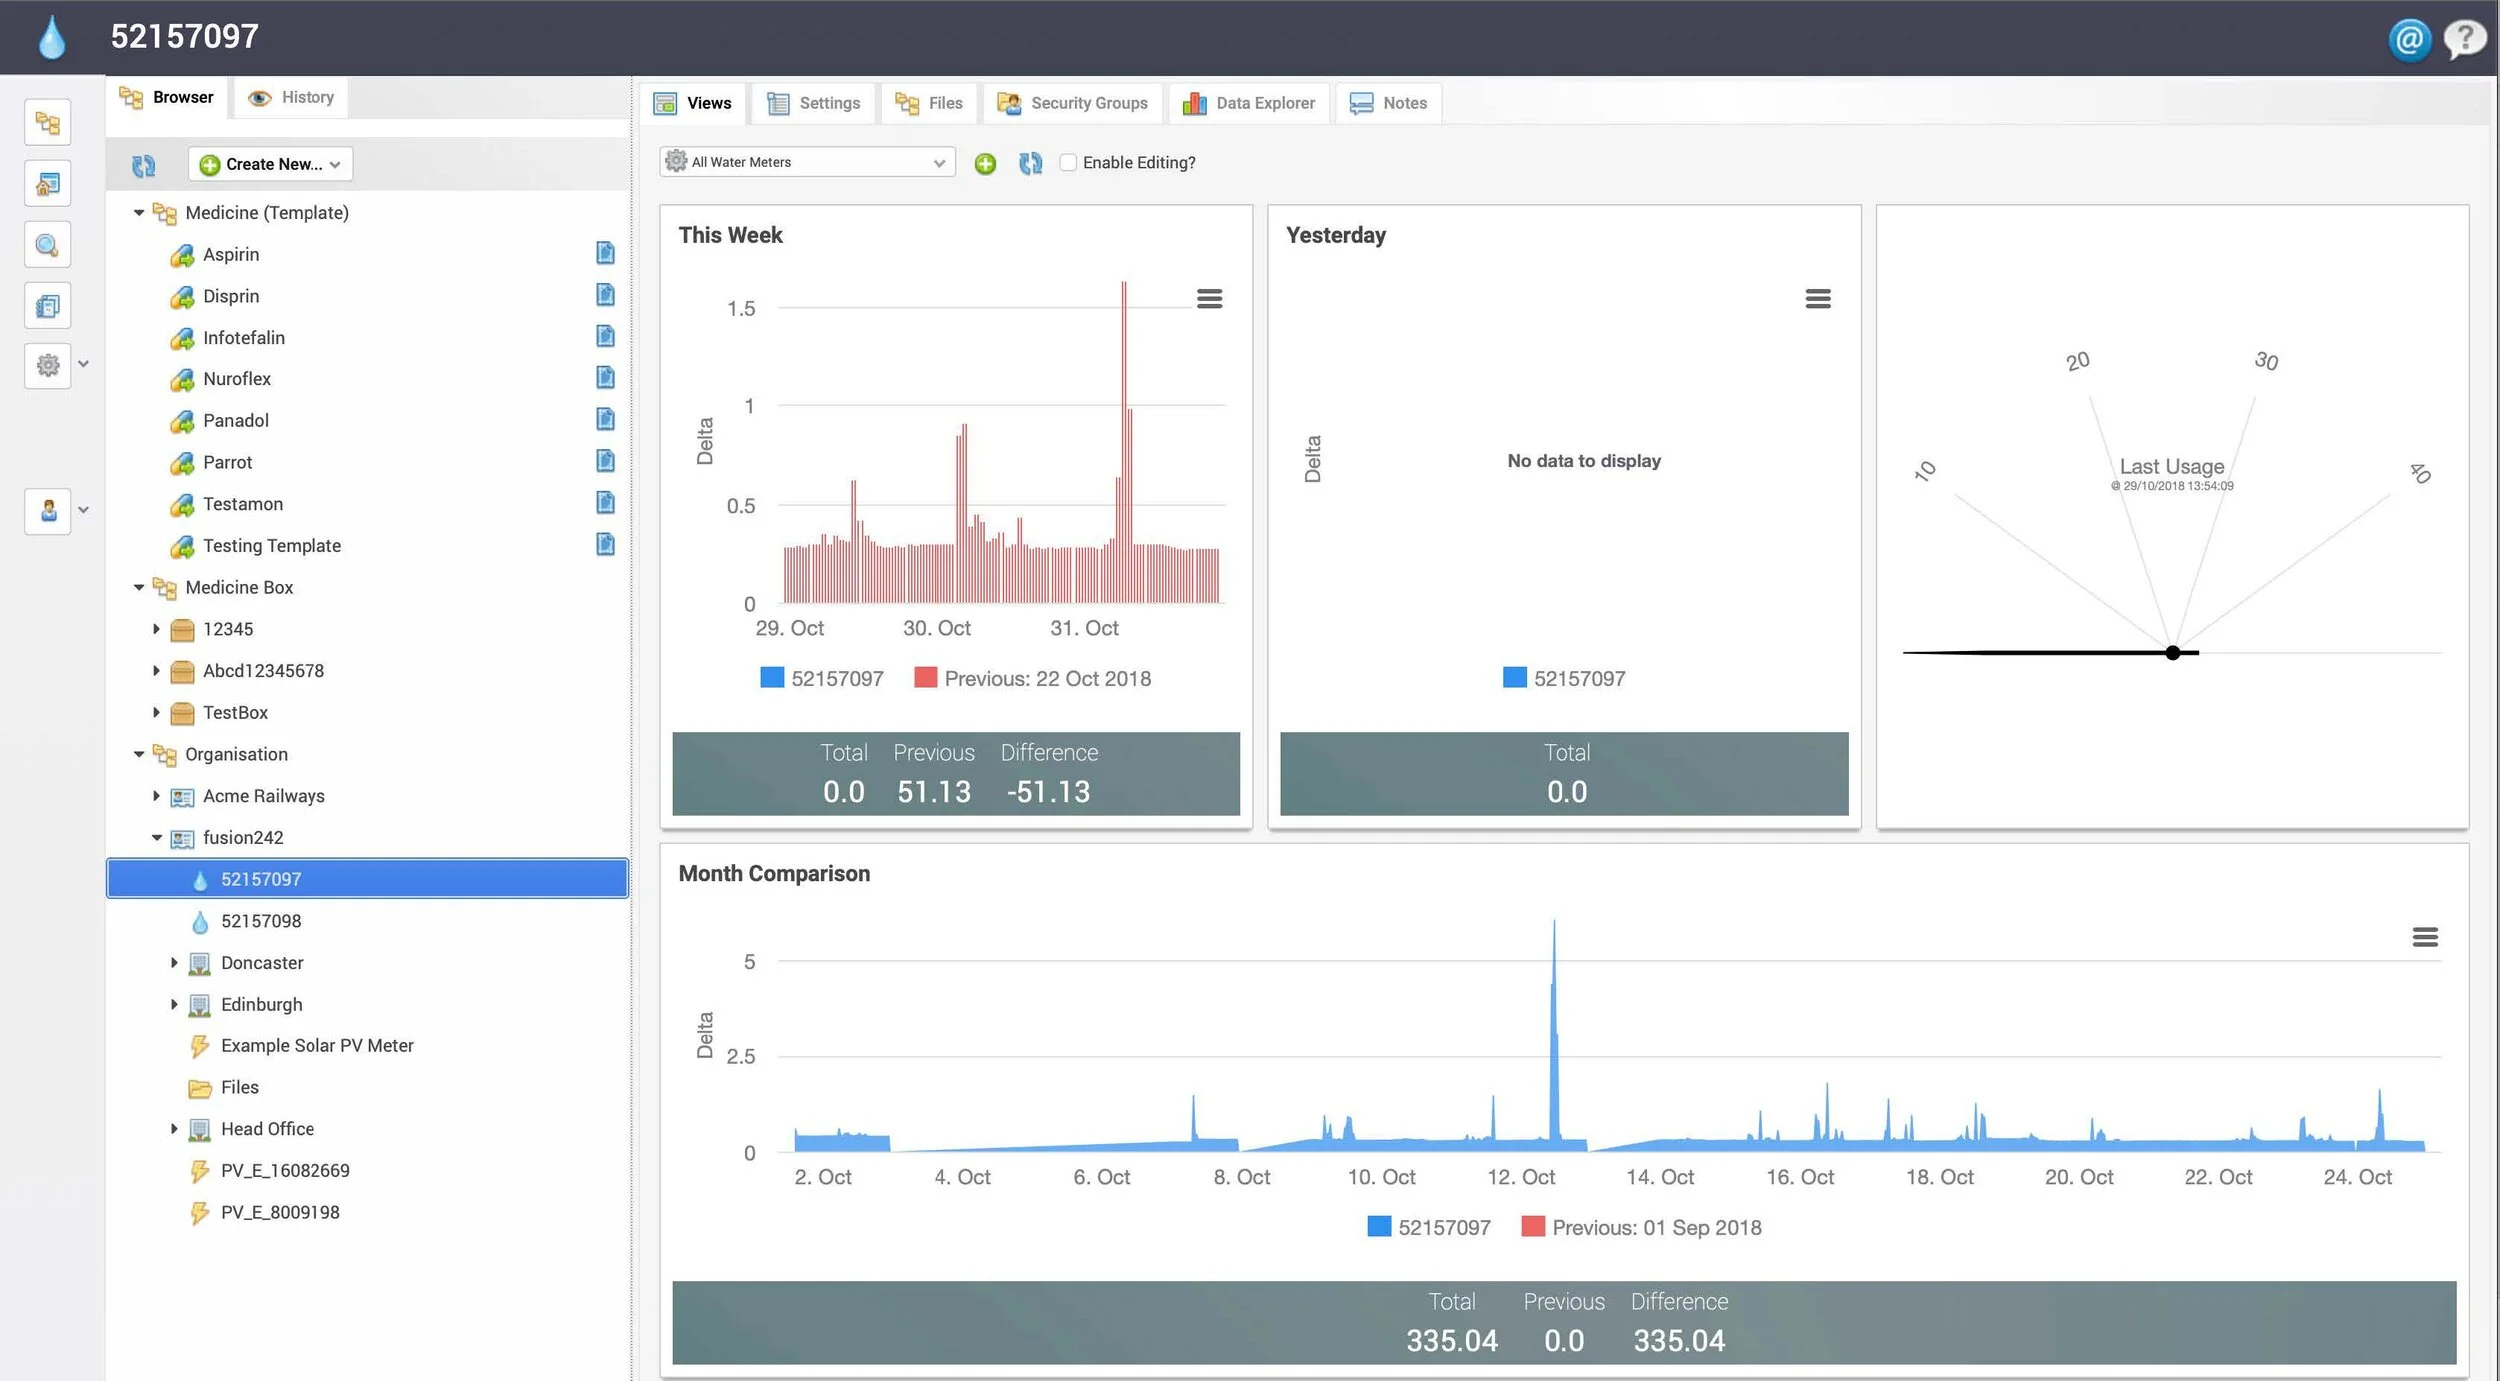
The platform is delivered as an API layer and a web portal application, providing user security and policy-based access management. The API can be used by authorised 3rd party applications to directly access information, and the portal provides administrative functionality as well as user dashboards, data visualisation, information management and more for manual actions.
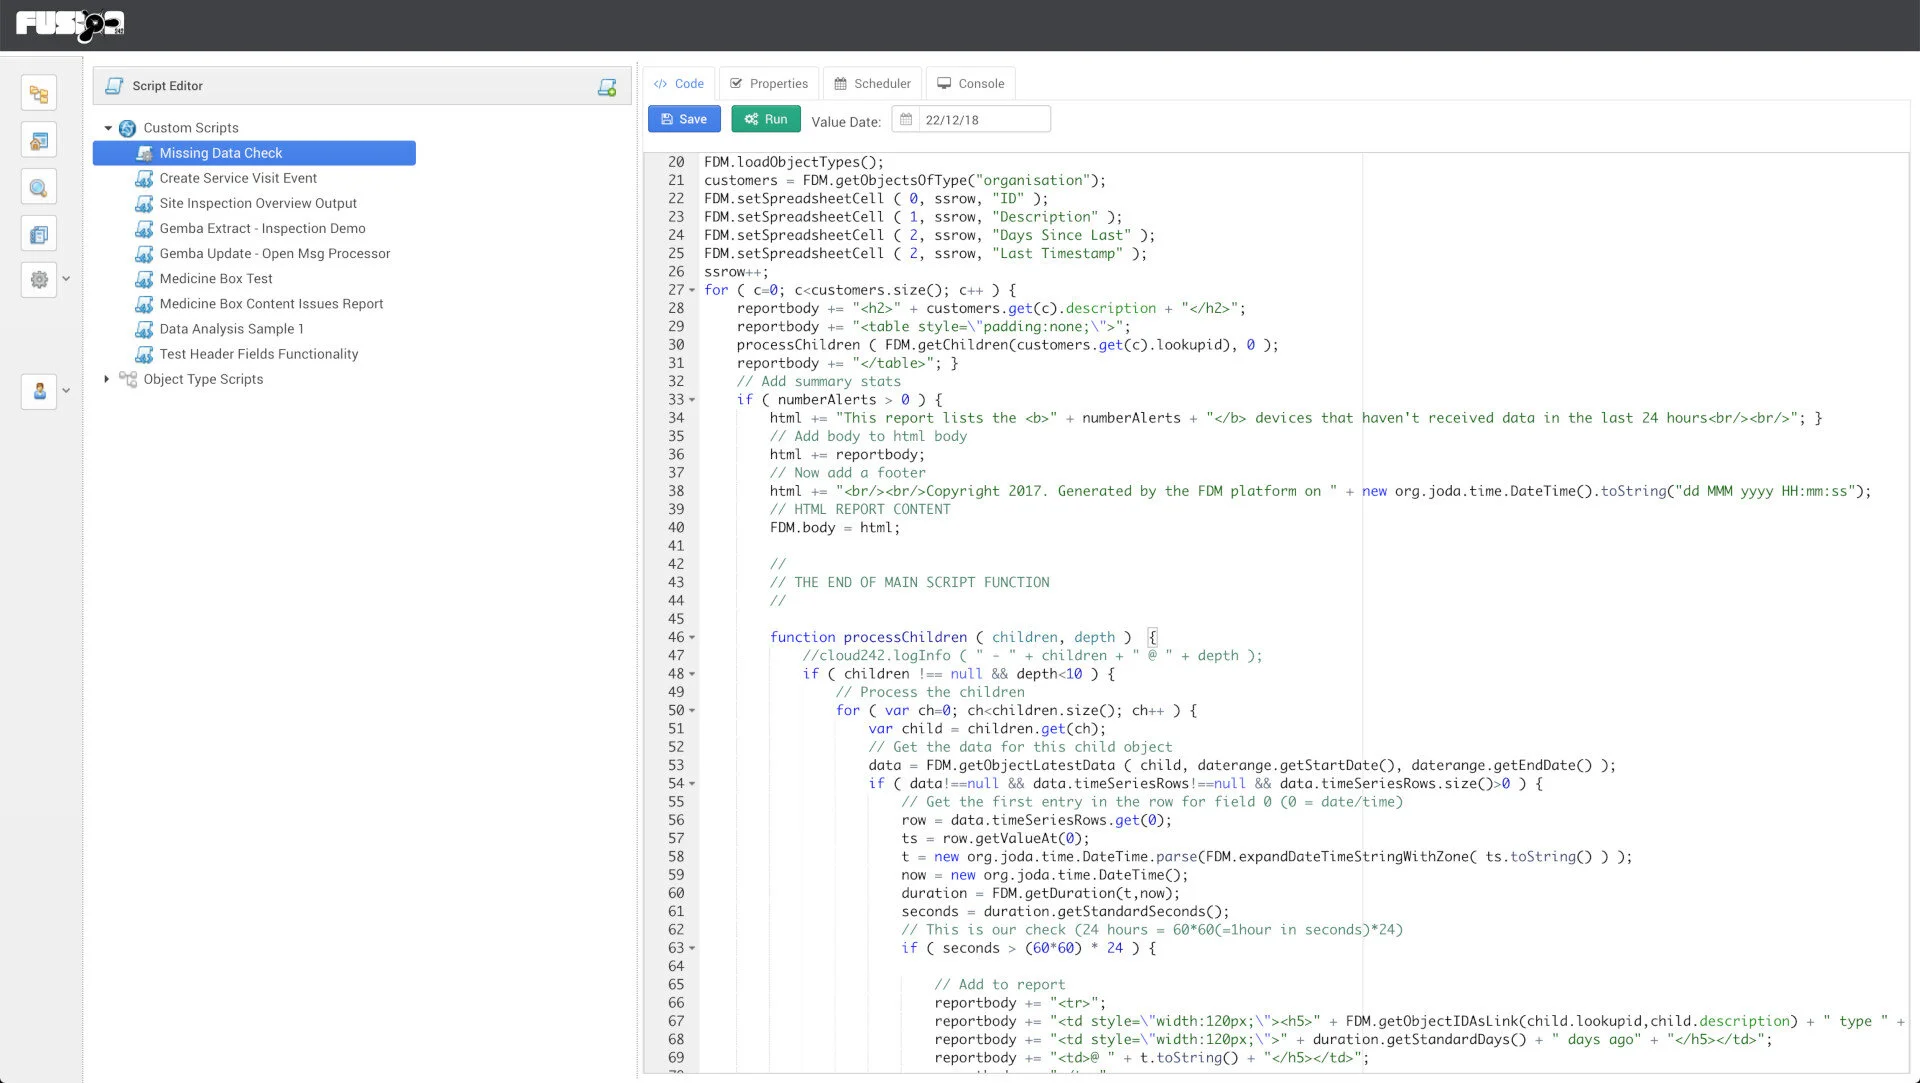
A Secure Space for Custom Development
Fusion Gemini incorporates a built-in development sandbox that allows custom logic to be created and executed for many purposes including reporting, visualisations, analysis,
integration and even custom API creation. In addition, custom Java libraries can be added to the application environment and made available via the sandbox for reusable custom functionality or implementation of IP restricted or security classified code.


Event-Driven Intelligence at Scale
AI and other system integration is a core architectural design in Fusion Gemini. Information from a model can be exported and pushed into AI models, can be accessed via API and can be enriched from external systems. Fusion Gemini implements an event driven architecture to enable asynchronous activities at scale, helping drive automation, analysis and decision making: internally or via external systems.
Capture Ground-Level Human Intelligence
For information capture at a site, we work with the GEMBA Note application that provides a human interface for capturing multimodal information and data using a journal or notebook paradigm. Additional features such as handwriting conversion, real-time collaboration on documents and even the ability to host video and voice calls about documents are available. GEMBA Note has it’s own API layer and integration pathways to get information to and from your teams to improve efficiency and decision making.